
One picture that shows where you sit and where you could go. An hour to make now, not a week.
A perceptual map gives the other person a single image to grasp where you sit, who you’re really competing with, and where the realistic gains are. That makes it useful any time you need someone to digest a competitive story quickly: a BD pitch, a partnership conversation, an internal team meeting, a town hall, a board presentation. The picture gives them something to hold onto and accelerates the conversation about positioning and growth.
The good news: AI has cut what used to be a week of senior strategist time down to about an hour. Which makes the question a perceptual map answers worth asking more often: where do we sit today, where could we move next?
What the chart shows you
One picture, four things at once:
- Where you actually sit, not where you think you sit.
- Who you’re really competing with, usually different from the aspirational set.
- Where the open lane is, and where it’s already too crowded.
- What kind of move is realistic, from here to there, given a focused year.
Where it matters most
BD is where this matters most. Your services stop being a list and become the path between two dots, which is what the prospect actually wants to buy. The conversation reframes itself: less what do you do?, more how do we get from one dot to the other?
How to actually make one
Four steps, roughly an hour.
- Pick the company and the real competitor set. 4 to 8 real competitors. The ones a buyer would actually compare you to, not just the aspirational set.
- Choose two axes that matter. Two dimensions that shape how the market sees the category. Premium vs. accessible. Specialized vs. broad. High-touch vs. self-serve. Niche expertise vs. scale. The axes are most of the work. Pick two that genuinely matter for the bet, not two that sound smart in a meeting.
- Get AI to draft it. A starting prompt: Create a perceptual map for [company] and these competitors: [list]. Use [axis 1] on the horizontal axis and [axis 2] on the vertical axis. Place each brand based on public positioning, customer perception, product mix, and market presence. Explain each placement in 1 to 2 sentences. Then suggest where [company] could realistically move over the next 12 months. If you have services or products that get the brand from one dot to the other, ask the model to add them to the chart and tag them to the axis each one moves. Now the chart shows what it would take, not just where you are.
- Pressure-test it. AI gets you to a draft. You still need to sanity-check before you put your name on it. Are these the right competitors? Are these really the right axes? Are any placements off? Is the target realistic? What would actually have to change to get there?
An Example
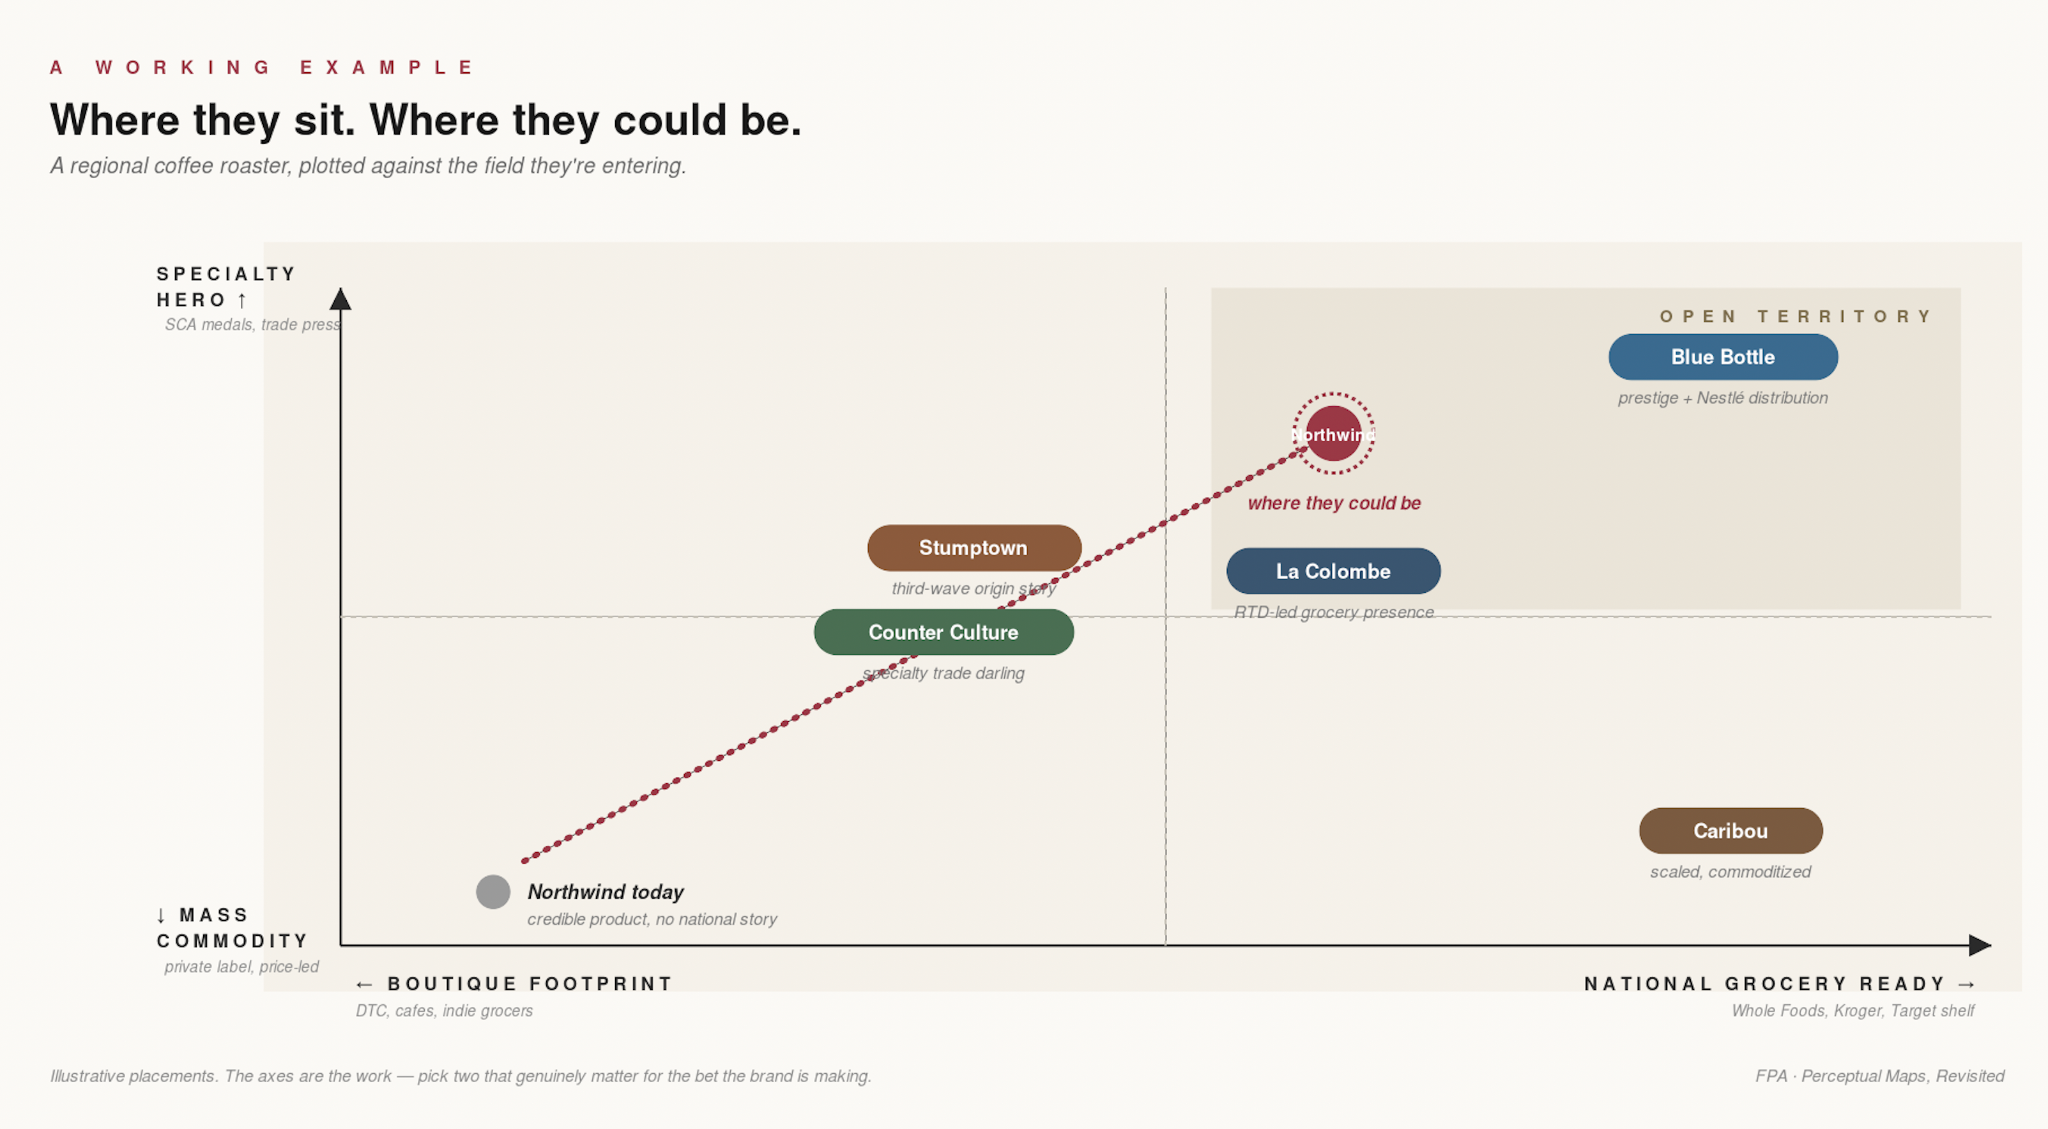
A regional coffee roaster vs. Blue Bottle, La Colombe, and a couple of mass-grocery names. Axes: specialty credibility × grocery scalability. The chart puts them two quadrants from where they want to be, sitting next to brands they don’t consider peers. Two surprises usually come out of this. The team is closer to the mass-grocery cluster than leadership thought, and they’re not competing with the brands they thought they were. The next chain-buyer meeting stops being a product pitch and becomes a conversation about closing that gap, which is what your services are for.
None of this is new thinking. What’s new is that one of these takes an hour now, not a week. Reach for one any time a pitch, a proposal, or a strategy conversation gets stuck on the question of where do we actually fit.